Planning appeal success rates and timescales
On this page are PINS' latest published statistics including the latest Ministerial Measures published 21/5/26:
- Appeal Success rates for s78 appeals, to 31st March 2026
- Appeal Success rates for s78 appeals by procedure (written reps, hearings, inquiries)
- Appeal Success rates for s78 appeals by development type
- Link to average success rates by LPA and by Inspector
- Planning appeal Timescales, month ending 30th June 2026
- Ministerial measures on timeliness of appeals, year ending 31st March 2026
Appeal Success rates for s78 appeals
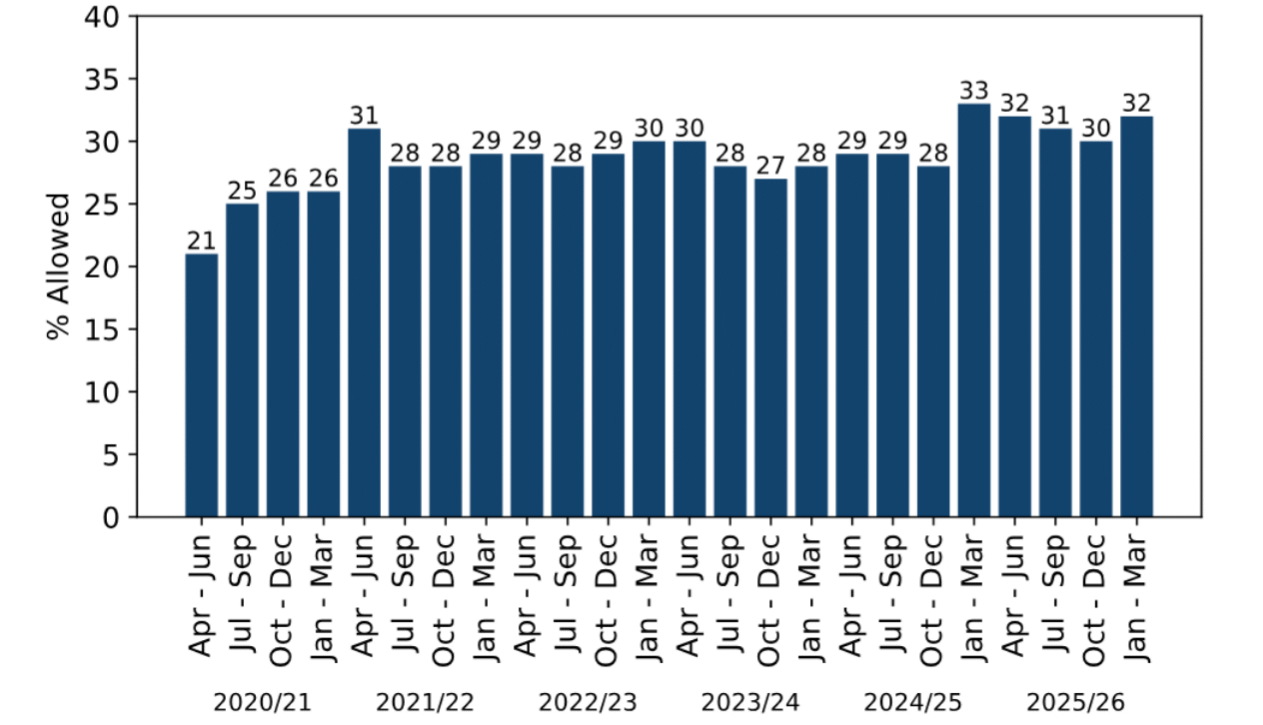
Planning appeal success rates over the past quarter January - March 2026 averaged 32%, according to statistics published by the Planning Inspectorate. Please note the overall average obscures wide difference between different types of appeal procedure (see figure 2) and between different types of development (see figure 3).
Figure 1. s78 planning appeal success rates by quarter for the past 5 years
Appeal success rates for written reps, hearings and inquiries
The appeal success rates for January - March 2026 were 30% for written representations appeals (navy line in the graph below) and 32% overall for all s78 planning appeals (black line). Written representation appeals made up 95% of planning appeals.
Appeals through the Hearings procedure (aqua line) had a success rate of 62% last quarter but comprised only 3.3% of appeals. Inquiries (orange line) had an appeal success rate of 61% last quarter but made up only 1.8% of s78 planning appeals.
Figure 2. s78 planning appeal success rates by procedure type

Tempting as it is to ask for a hearing or an inquiry, the Planning Inspectorate has strict criteria for deciding when these procedures can be used, which can be found in PINS' Criteria for determining the procedure for appeals guide.
Appeal success rates by type of development
Certain types of development are generally more successful on appeal than other types, for example, major applications for 10+ dwellings have more than double the success rate on appeal compared to minor applications for under 10 dwellings (in 2025/26, a national average of 53% for major residential developments compared to 24% for minor residential developments). Minor residential developments for less than 10 new dwellings are much less likely to be successful (average 24%) compared to the average success rate of 32% for all development types shown in figure 2 above.
Householder development also has a significantly higher success rate on appeal, on average 36% over 2025/26, compared to the average of 32% for all developments.
Figure 3. Percentage of appeals allowed by type of development
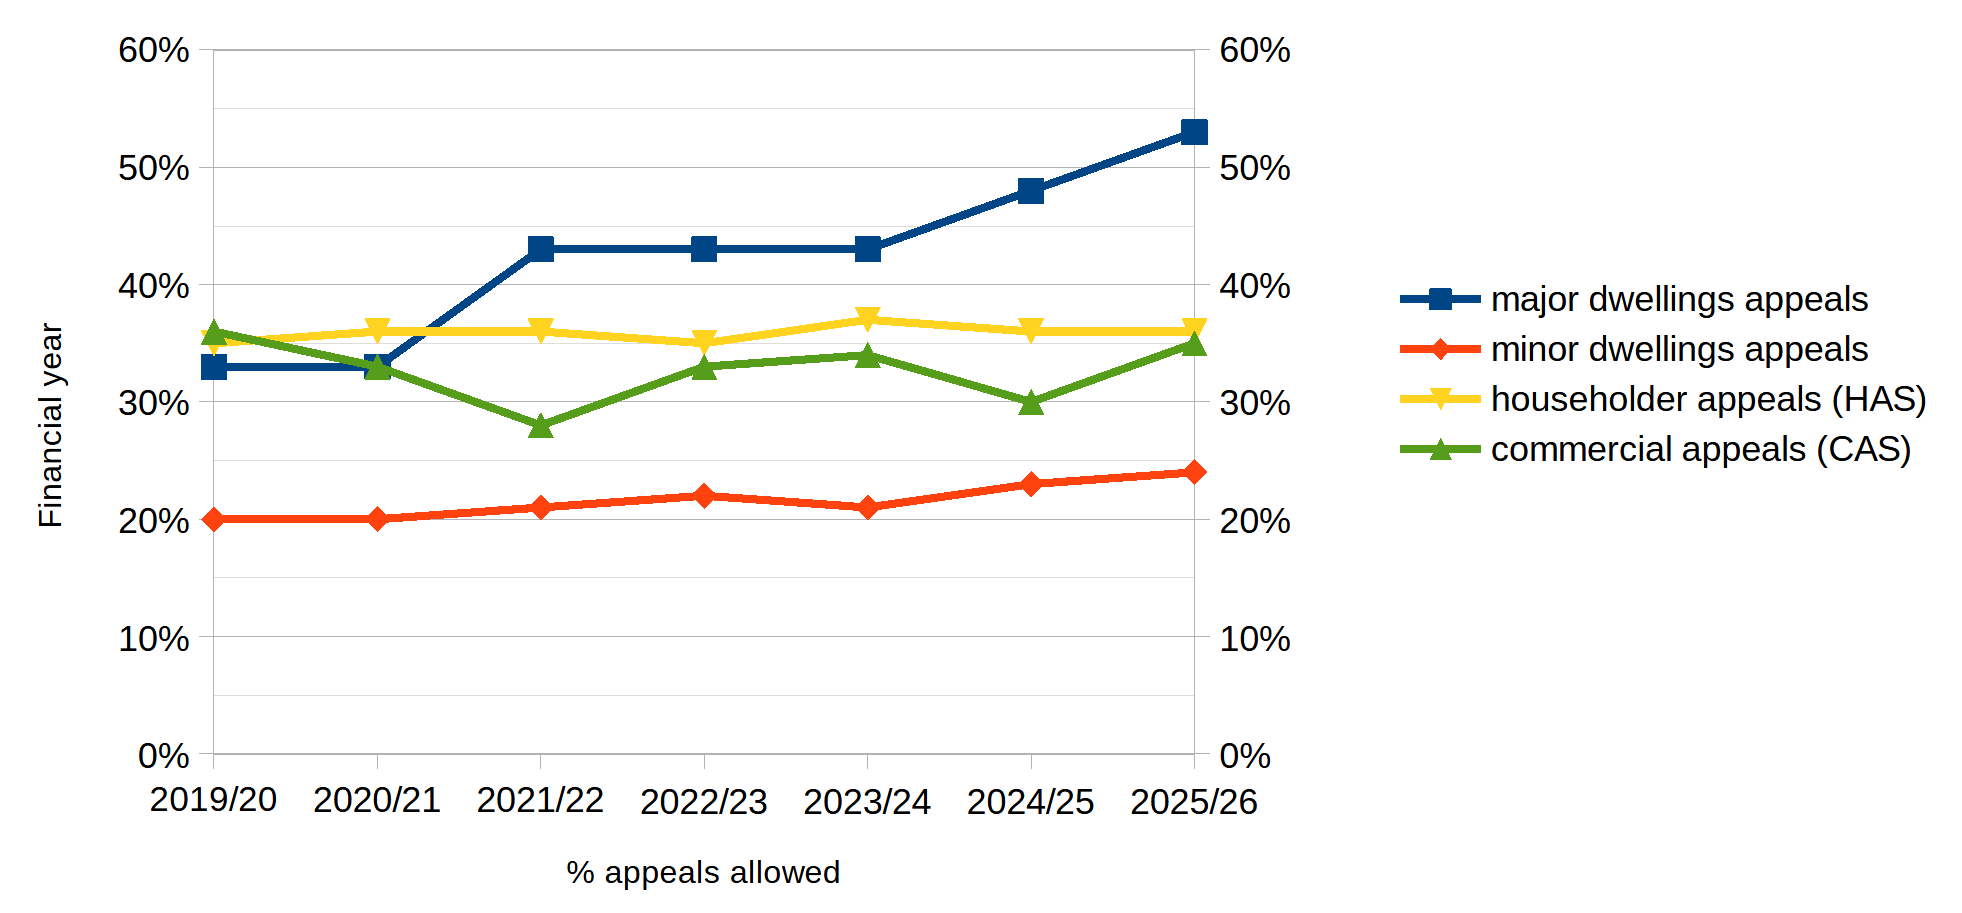
Sources: Planning Inspectorate Annual and Quarterly Statistics Annual Time Series tables published 23rd April 2026, from tables 2.5a, 2.6a and 2.7.
Appeal success rates by LPA and Inspector
Local Planning Authorities' appeal success rates for the past 3 years ending 31st March 2025, 2024 and 2023 are available for each Local Planning Authority here, for s78 appeals, householder appeals and enforcement appeals.
Success rates by individual Inspectors for the past 2 years ending 31st March 2024 and 2025 are also available.
Planning appeal Timescales
For the month ending 30th June 2026 the Planning Inspectorate's timescales were:
| Planning appeal timescales | Median (weeks) | no. Decisions |
| s78 written representations | 17 weeks | 758 |
| s78 hearings | 19 weeks | 52 |
| s78 inquiries | 27 weeks | 15 |
| Householder appeals | 12 weeks | 351 |
| Enforcement written reps | 67 weeks | 230 |
Full details are in Annex B on the Planning Inspectorate webpage.
Ministerial Measures on Timeliness of appeals
The latest Ministerial Measures on how quickly planning applications are decided were published on 21st May 2026. They show further improvement in timescales and provide a handy picture to share with clients when they ask you, "How long....?"
Figure 1: Percentage of appeals decided within set timescales, year ending March 2026
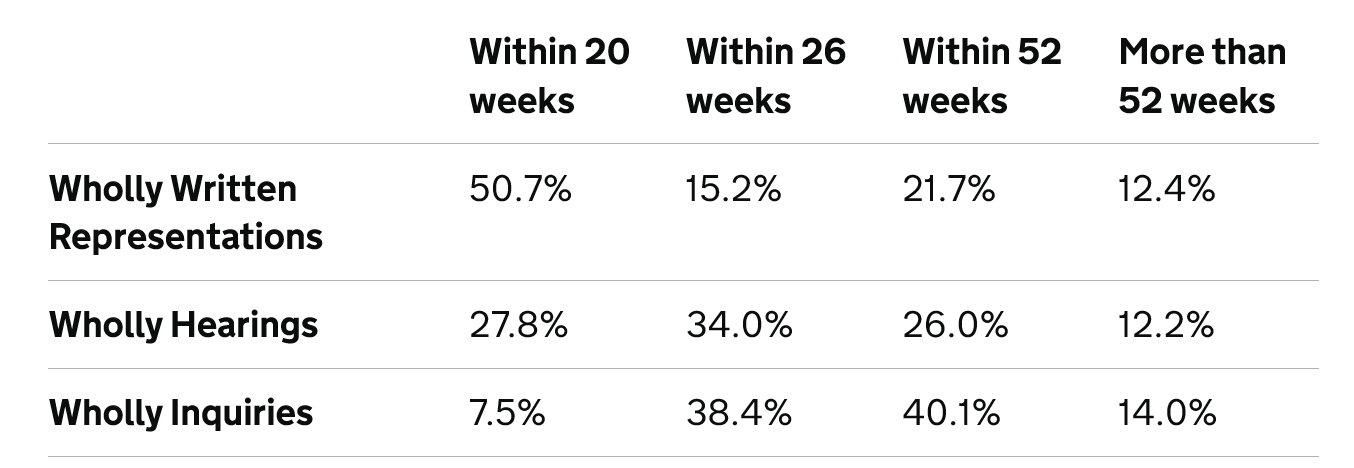
PINS' efforts to improve timescales are certainly working. Written reps have improved significantly, compared to 3 months ago when 42.0% were decided within 20 weeks for the year ending December 2025, now a significantly better 50.7%.
Hearings' timescales have also improved compared to 3 months previously, when 24.4% were decided within 20 weeks, now up to 27.8%. For inquiries, 3 months ago 20.5% took over 52 weeks to be decided. Timescales are rapidly improving across the board.
Figure 2: Percentage of appeals decided within 20, 26, 52 or 52+ weeks, year ending 31 March 2026
Timescale is measured by PINS from the date the appeal is deemed "valid" until the date of the appeal decision.
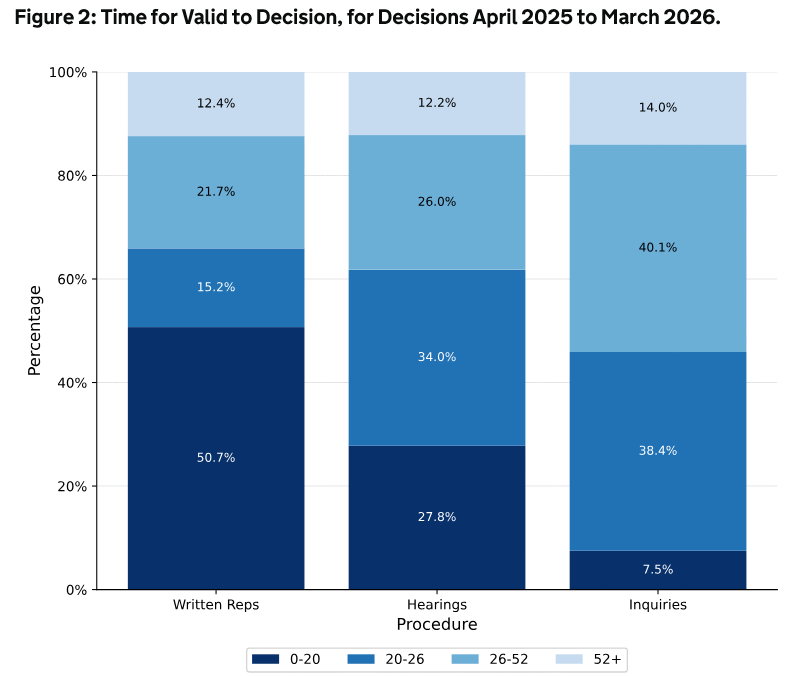
Figure 3: PINS timescales for written representation appeals, year ending March 2026
(Count is in thousands)
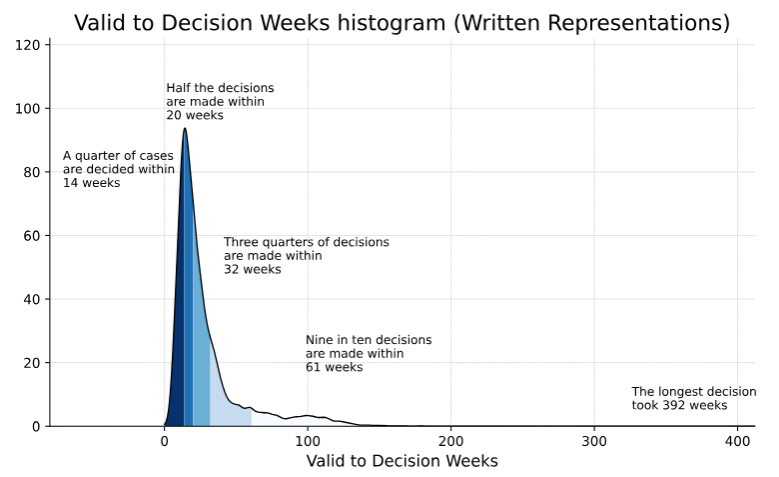
Figure 4: PINS timescales for hearings, year ending 31 March 2026
(Count is in thousands)
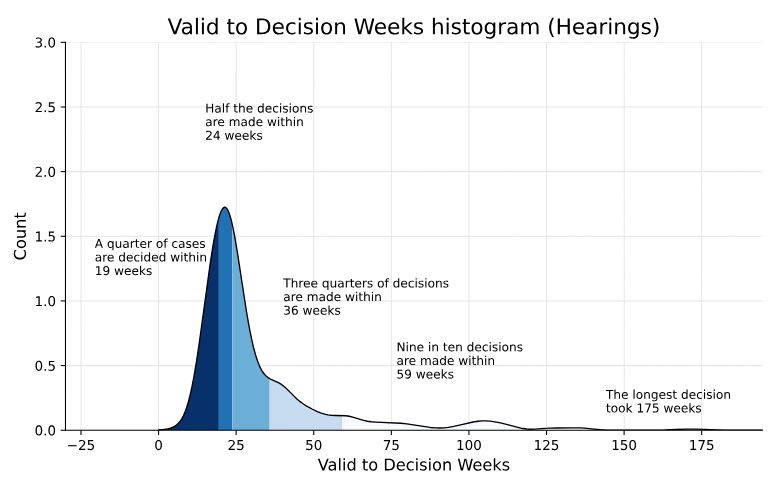
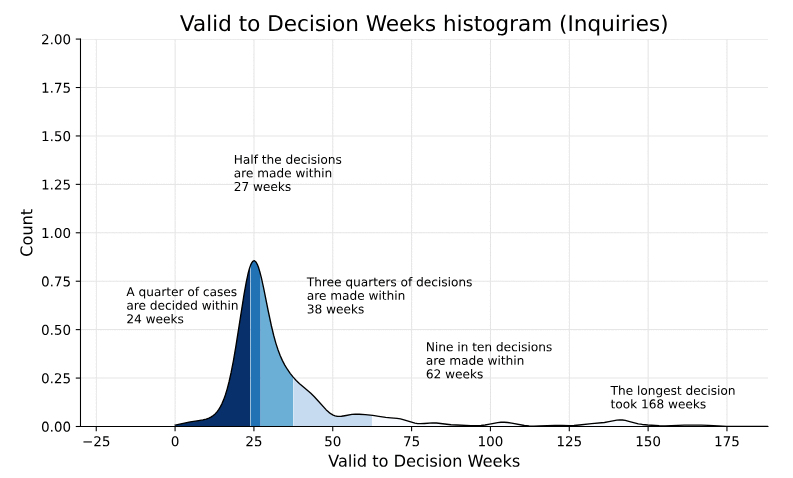
Figure 5: PINS timescales for inquiries, year ending 31 March 2026
(Count is in thousands)
To find appeals of interest to you, use the search on our Home page.
