Planning appeal success rates and timescales
On this page are PINS' latest published statistics including the latest Ministerial Measures published 26th November 2024:
- Appeal Success rates for s78 appeals, to 2024/25 Q3
- Appeal Success rates for s78 appeals by procedure (written reps, hearings, inquiries)
- Appeal Success rates for s78 appeals by development type
- Link to average success rates by LPA and by Inspector
- Planning appeal Timescales, month ending 31 December 24
- Ministerial measures on timeliness of appeals, year ending 30th September 2024
Appeal Success rates for s78 appeals
Planning appeal success rates over the past quarter October - December 2024 averaged 28%, according to statistics published by the Planning Inspectorate.
Figure 1. s78 planning appeal success rates by quarter for the past 5 years
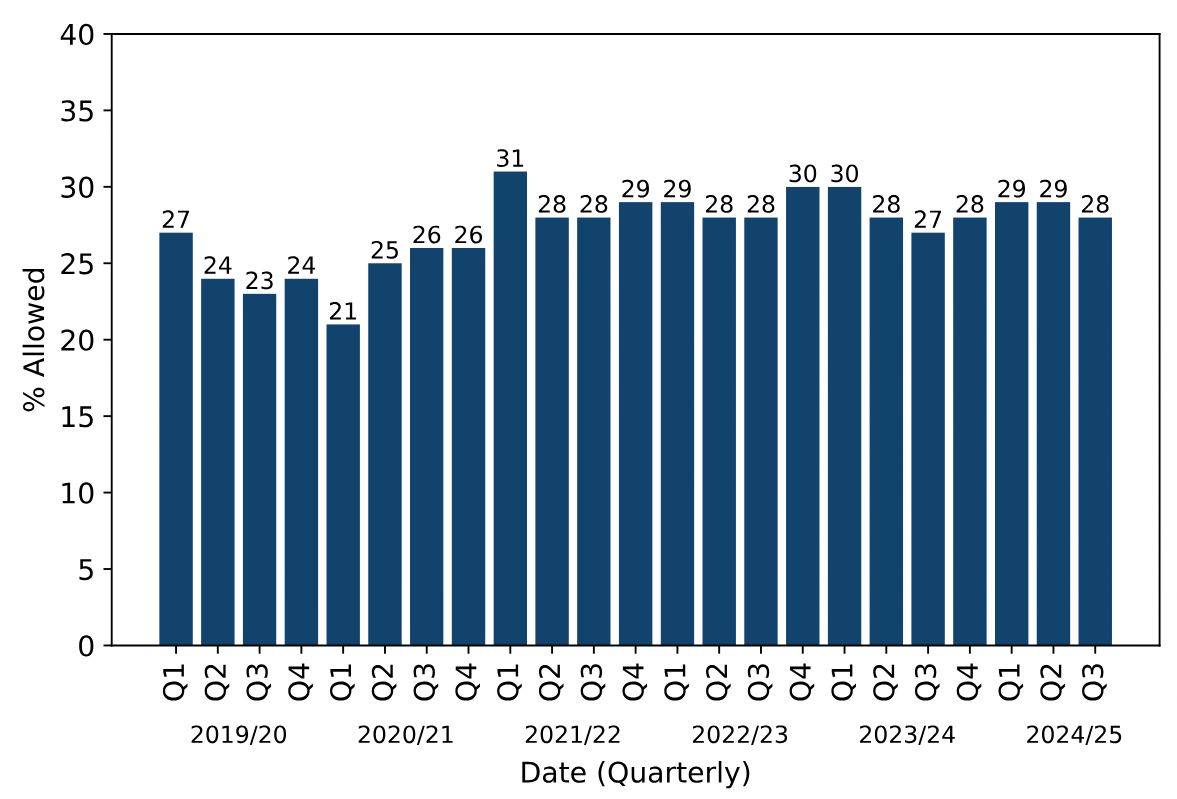
Please note the overall average shown above obscures differences between different types of development and different appeal procedures.
Appeal success rates for written reps, hearings and inquiries
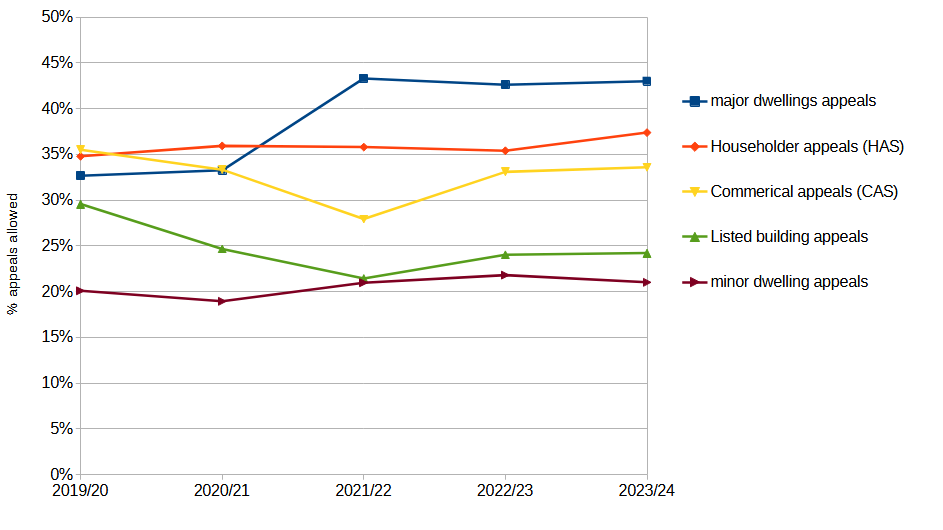
The appeal success rates for October-December 2024 (Q3 2025) were 26% for written representations appeals (aqua line in the graph below) and 28% overall for all s78 planning appeals (navy blue line). Written representation appeals make up 92.8% of planning appeals.
Appeals through the Hearings procedure (orange line) had a higher success rate of 48% last quarter but comprise only 4.6% of s78 planning appeals. Inquiries (black line) had an appeal success rate of 64% last quarter but make up only 2.6% of s78 planning appeals.
Figure 2. s78 planning appeal success rates by procedure type

Tempting as it is to ask for a hearing or an inquiry, the Planning Inspectorate has strict criteria for deciding when these procedures can be used, which can be found in Annex K of the PINS Planning Appeals Procedural Guide.
Appeal success rates by type of development
Certain types of development are generally more successful on appeal than other types, for example, major applications for 10+ dwellings have double the success rate on appeal compared to minor applications for under 10 dwellings. Householder development also has a significantly higher success rate on appeal than other types of appeal.
Figure 3. Percentage of appeals allowed by type of development
Appeal success rates by Inspector, LPA and development type
The annual success rates for s78 appeals, householder appeals and enforcement appeals for the 2 years ending 31st March 2023 and 31st March 2024 are available for individual Inspectors here and for each Local Planning Authority here.
Planning appeal Timescales
For the month ending December 2024 the Planning Inspectorate's timescales were:
| Planning appeal timescales | Median (weeks) | no. Decisions |
| s78 written representations | 30 | 738 |
| s78 hearings | 22 | 43 |
| s78 inquiries | 31 | 10 |
| Householder appeals | 18 | 291 |
| Enforcement written reps | 56 | 145 |
Full details are on the Planning Inspectorate webpage.
Ministerial Measures on Timeliness of appeals
The latest Ministerial Measures on how quickly planning applications are decided were published on 22nd August 2024. They show further improvement in timescales and provide a handy picture to share with clients when they ask you, "How long....?"
Figure 1: Percentage of appeals decided within set timescales, year ending Sept 2024
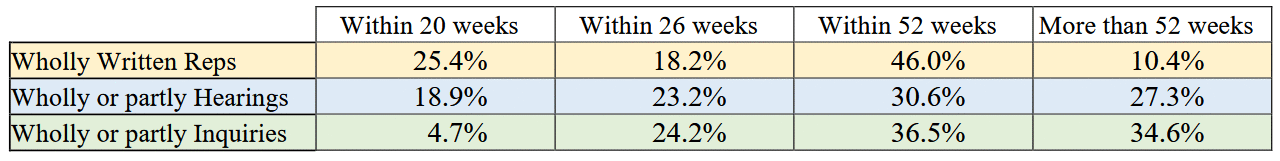
Figure 2: Percentage of Decisions by 20, 26, 52 or 52+ weeks, year ending September 2024
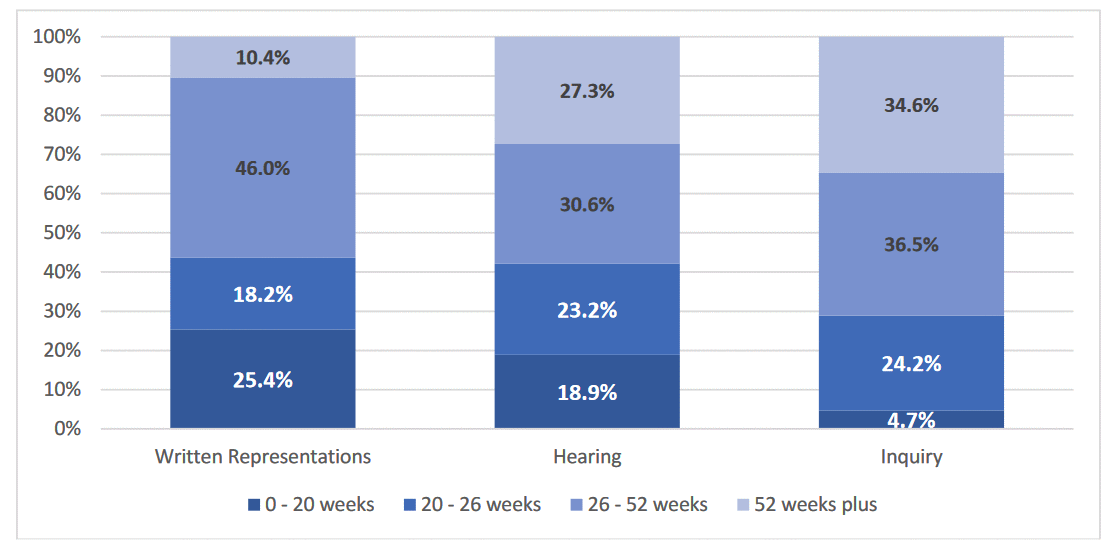
Figure 3: PINS timescales for written representation appeals, year ending September 2024
(Count is in thousands)
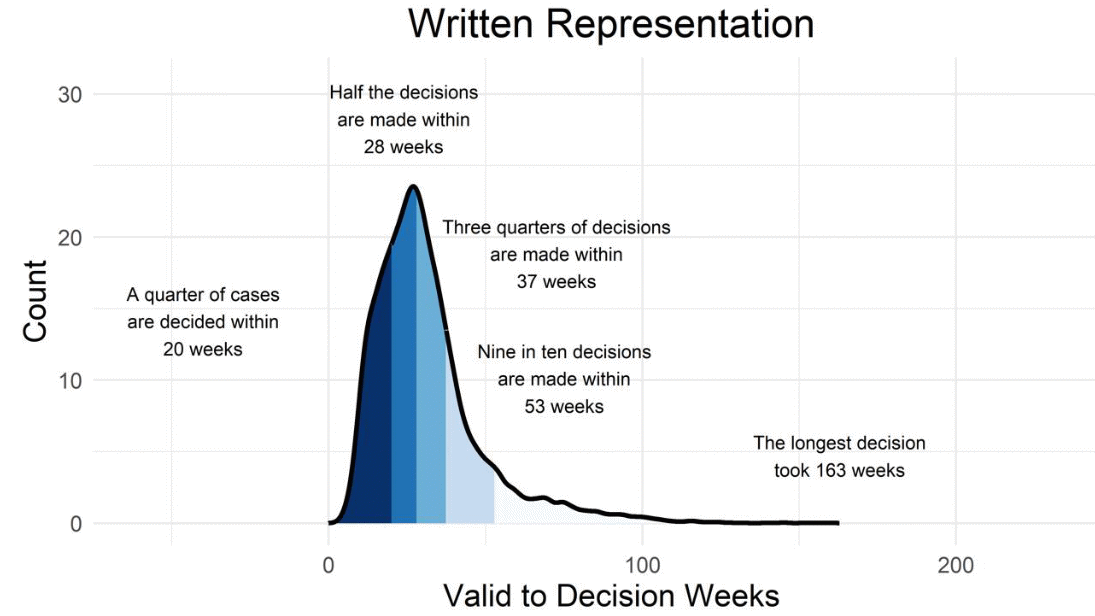
Figure 4: PINS timescales for hearings, year ending 30th September 2024
(Count is in thousands)
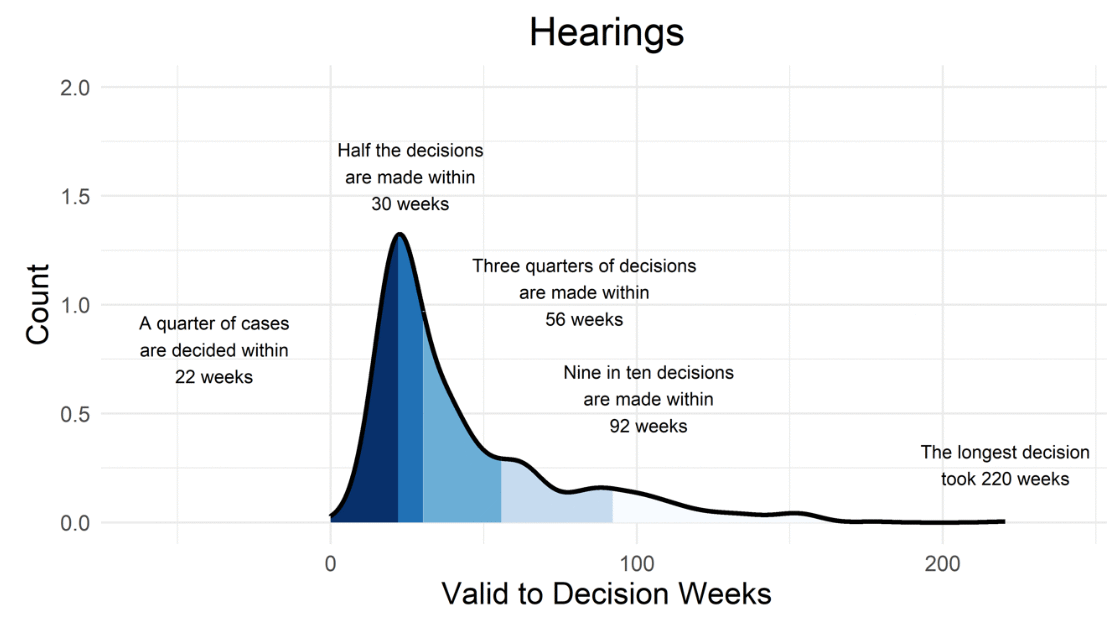
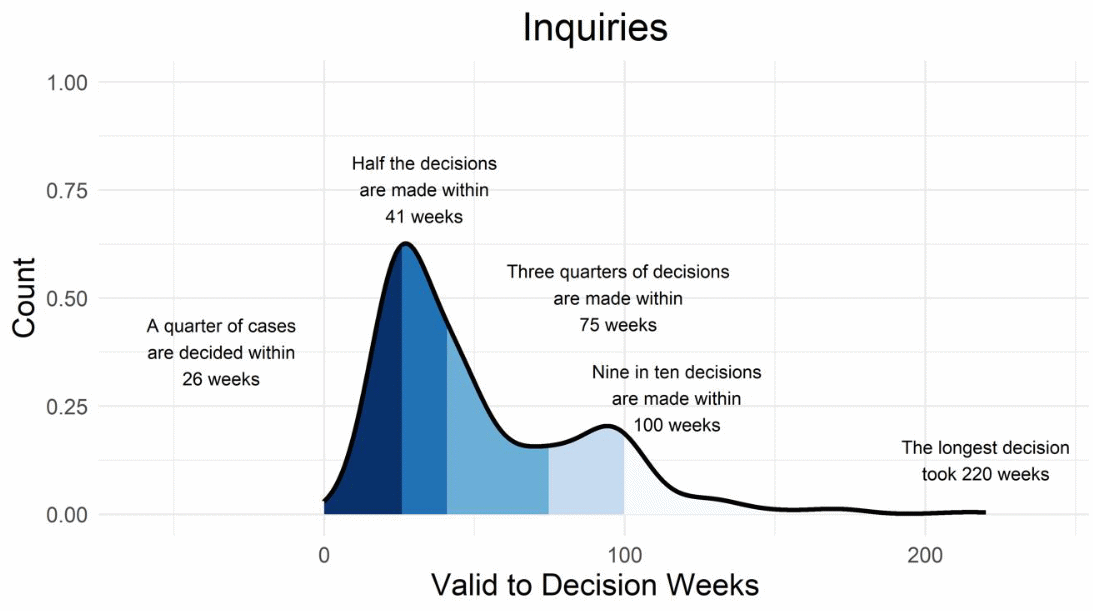
Figure 5: PINS timescales for inquiries, year ending 30th September 2024
(Count is in thousands)
To find appeals of interest to you, use the search on our Home page.
